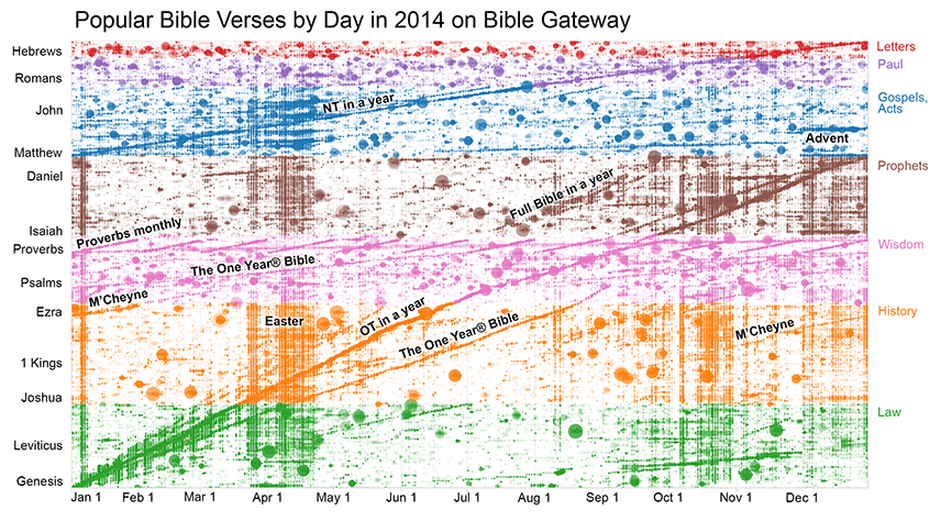
With books of the Bible on the y axis and the calendar year along the x axis, this graph plots which verses of the Bible were read on Bible Gateway throughout the year. A couple of things should jump out at you. There are times of the year that the Bible site gets more traffic, probably indicating more Bible reading in general, such as the month of Easter. You can also clearly see paths readers took through the Bible, such as the various reading programs noted on the cluster map.
Check out the Bible Gateway Year in Review 2014 for other charts and metrics. This was the year of a major overhaul of Bible Gateway’s design and the introduction of many new features, such as the Bible Gateway Blogger Grid (of which The Master’s Table is a partner). You may have noticed the Verse of the Day in the left-hand sidebar; you can get Verse of the Day sent to your email daily. Visit Bible Gateway for this and many new features.